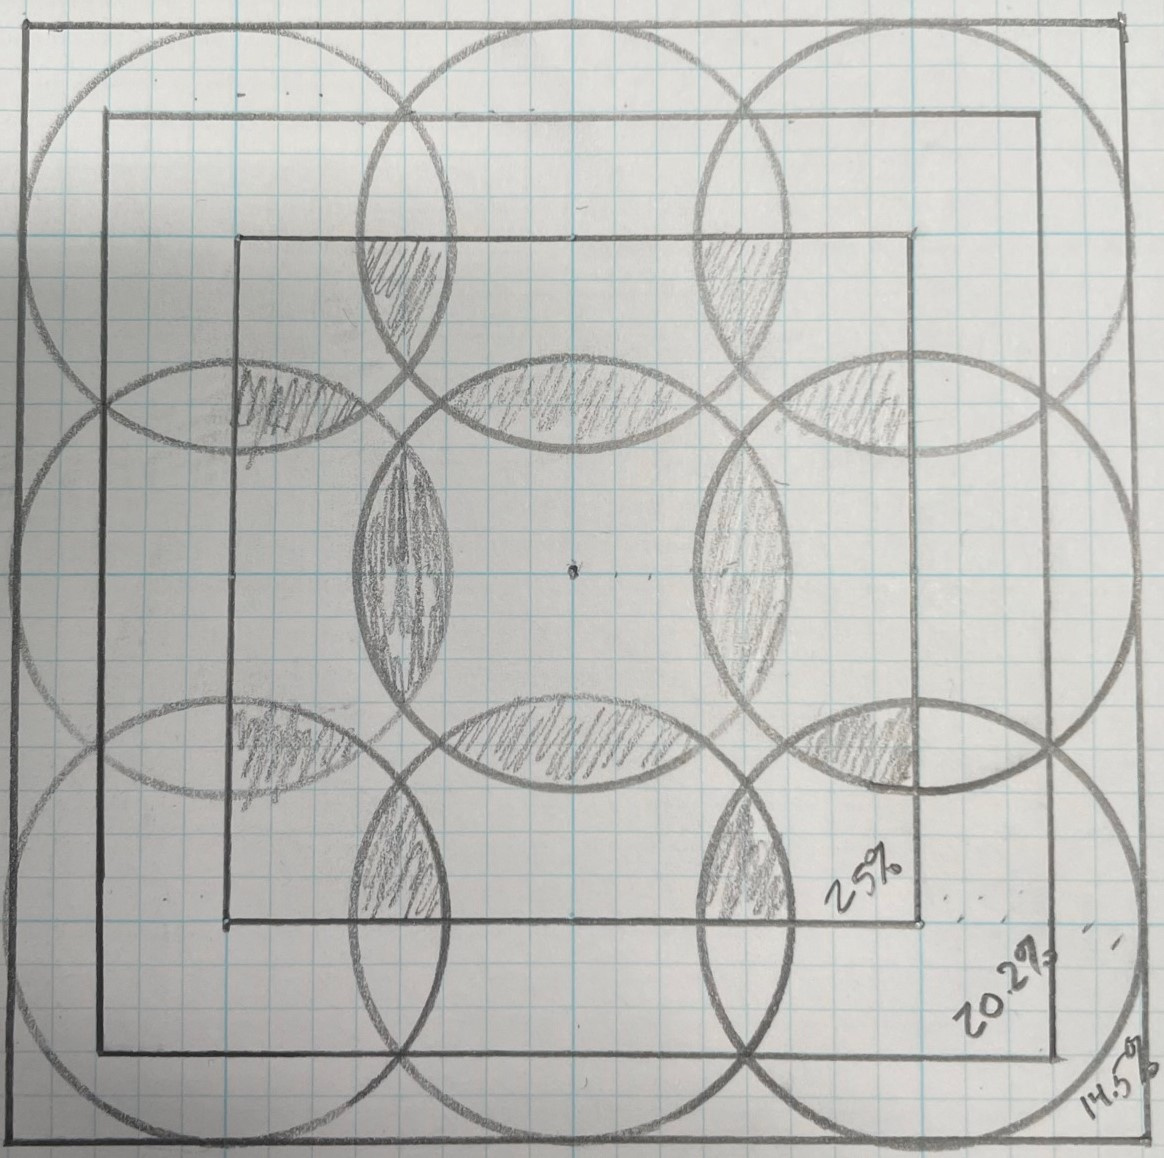
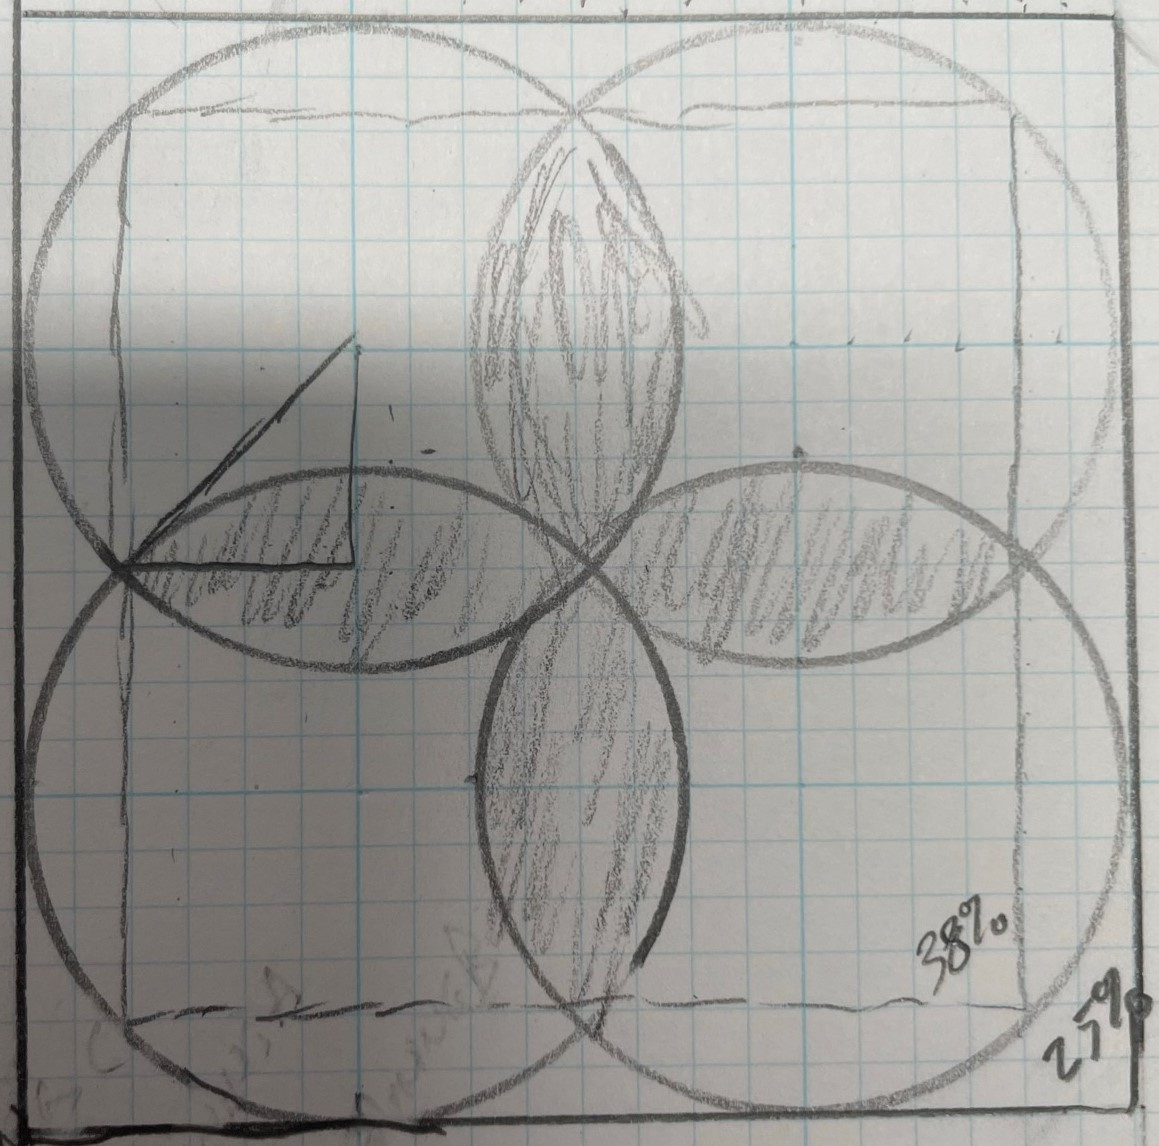
Speaker Coverage Patterns - From what is the % derived?


I understand that I'm doing math on what may be essentially a jargon issue, but still...
I'm developing my own calculators for speaker coverage patterns and have been trying to integrate the "50% coverage" and "20% coverage" benchmarks... but what are these percentages meant to refer to?
They don't seem to refer to the ratio of overlapped area of a neighboring speaker to a single speaker's coverage area. The math was kinda painful, but in the end wasn't close. (In any case, a "50%" overlap pattern overlaps noticeably less than 50% of its neighbor... just by eyeballing.)
My gut assumed the following: given a line through the centers of two equal and overlapping circles; the ratio of the line length falling within the overlap to the length of the circles' diameter." This means the 50% works. (The neighboring pattern overlaps by half - 50% - of the diameter of the circle.) However, the 20% figure should actually then be about 29.3% by this math. More precisely: ((-1 * SQRT(2))+2)/2.
I wonder if perhaps this is supposed to represent the aggregate amount of overlapped area within the pattern? I haven't tried calculating that, but I'm willing to try if that's the intention. But starting and ending where? Within a square/rectangle defined by the centers of the outermost speakers, as shown here? (Edit: I solved it below as well.)
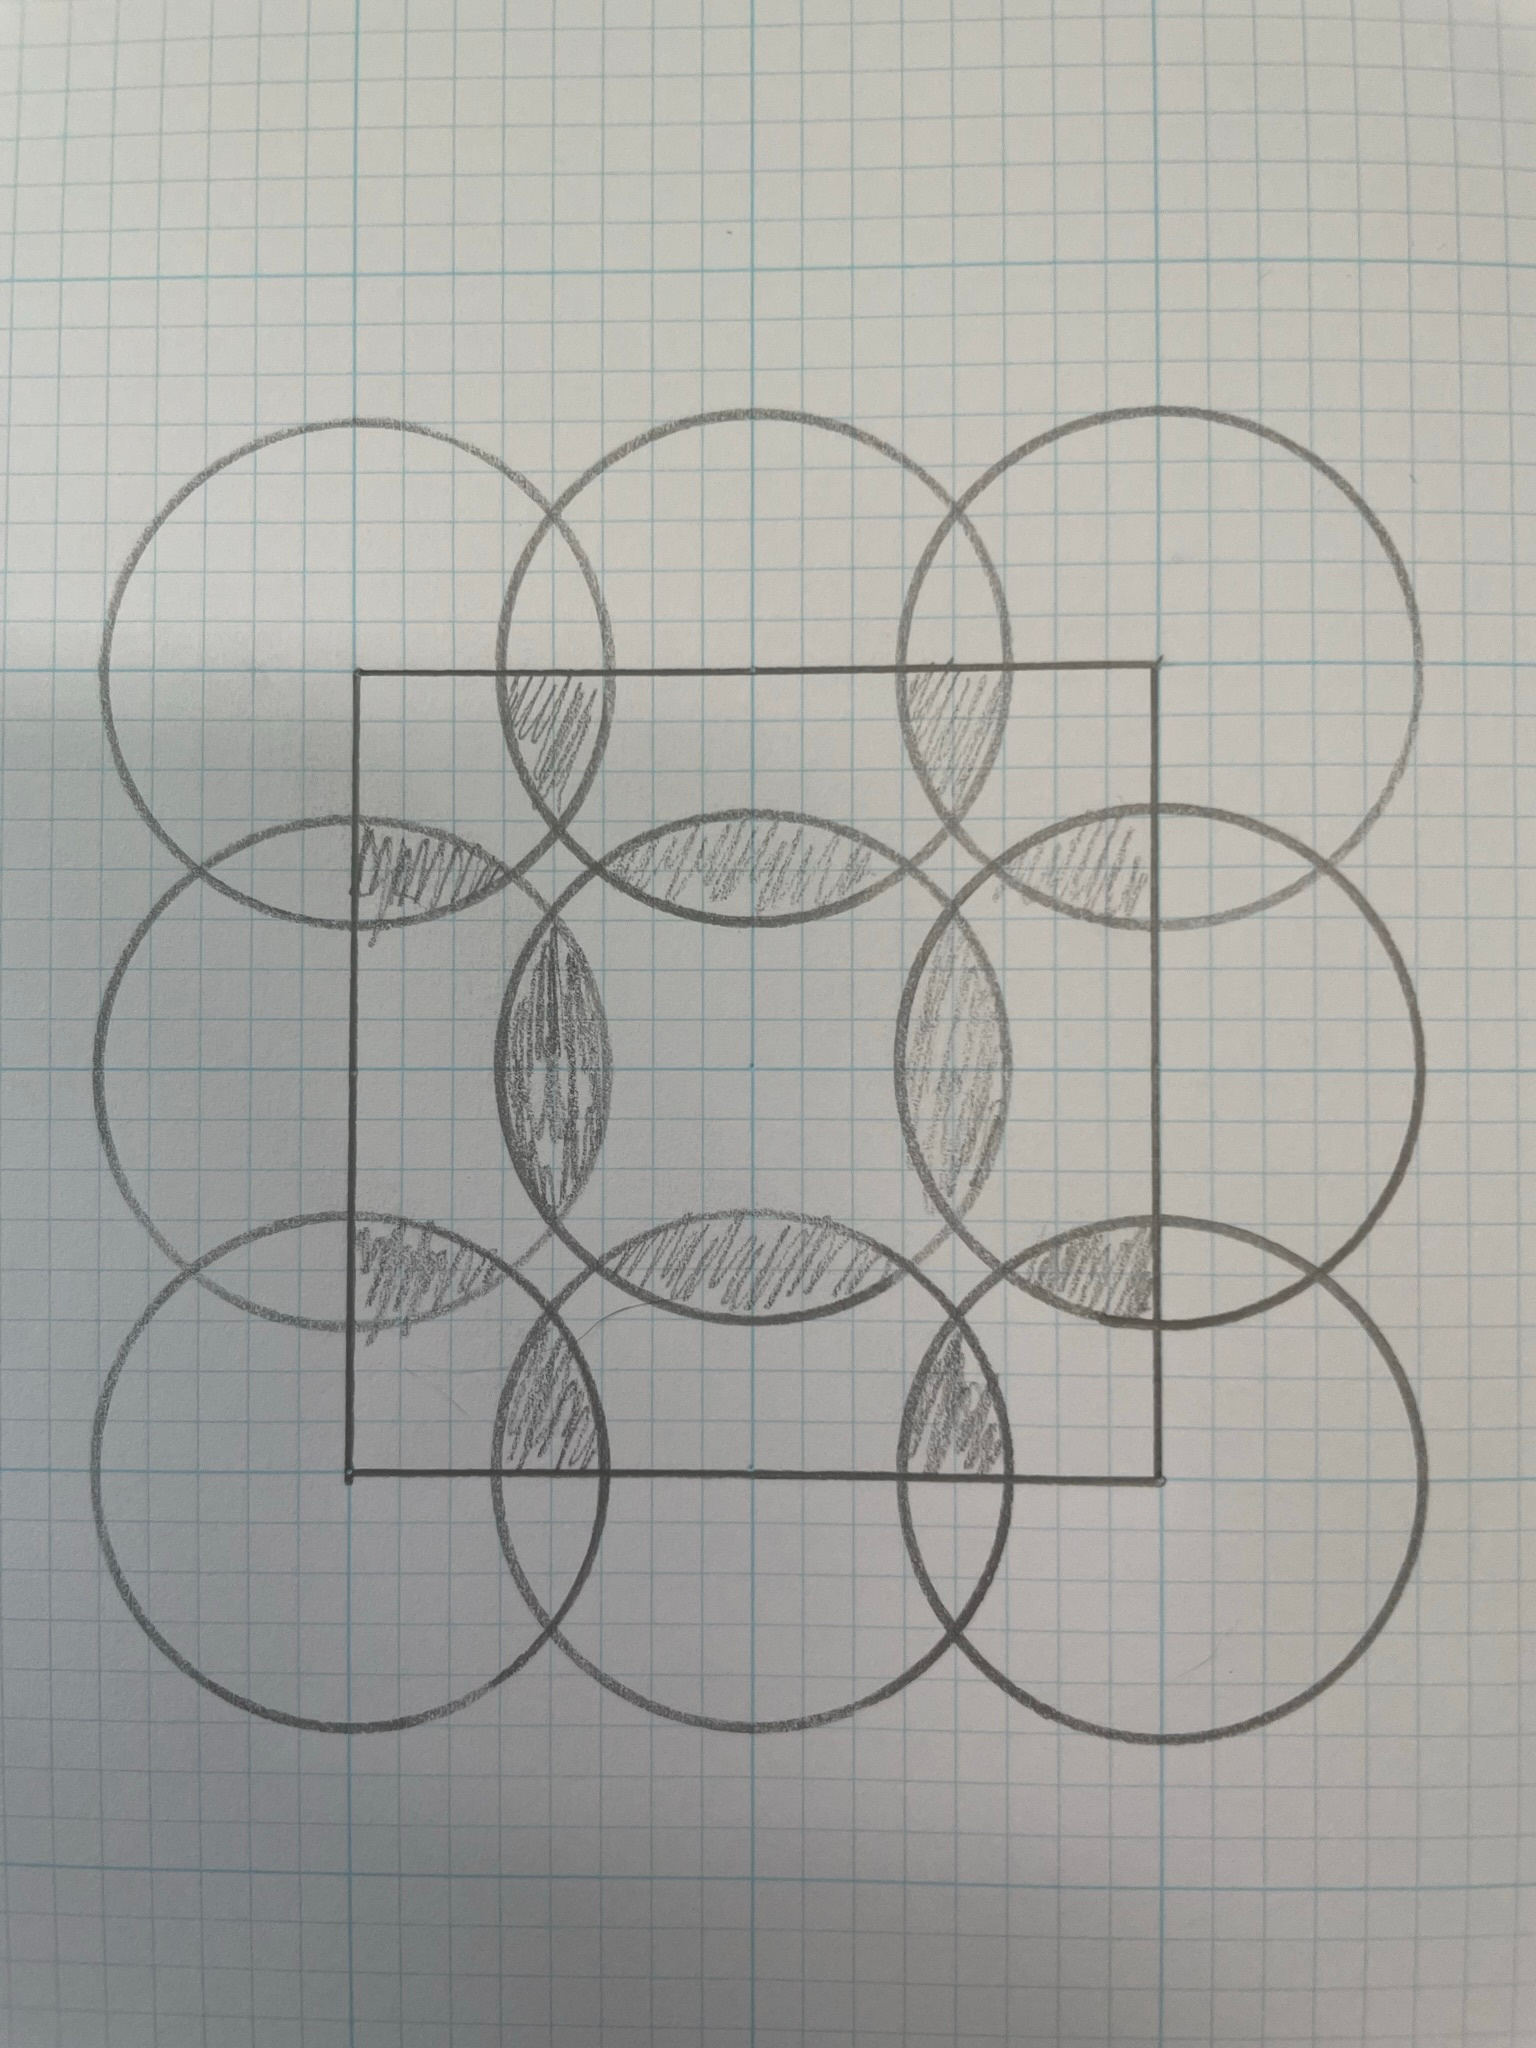
Does anyone know where these terms originated or what math they purport to represent?
(Update: In the above image, 25.56% of the square is covered by overlaps in speaker coverage. Looks like this is not the solution to my query, as the pattern is 'looser' than the "20%" overlap pattern.)
(Update: I ended up solving the overlapping area by percentage for several different permutations of overlapping circles and bounding squares. I didn't come up with anything that would match the "50%" and "20%" patterns. See Below. My calculated percentages are in the lower right of each bounding box.)